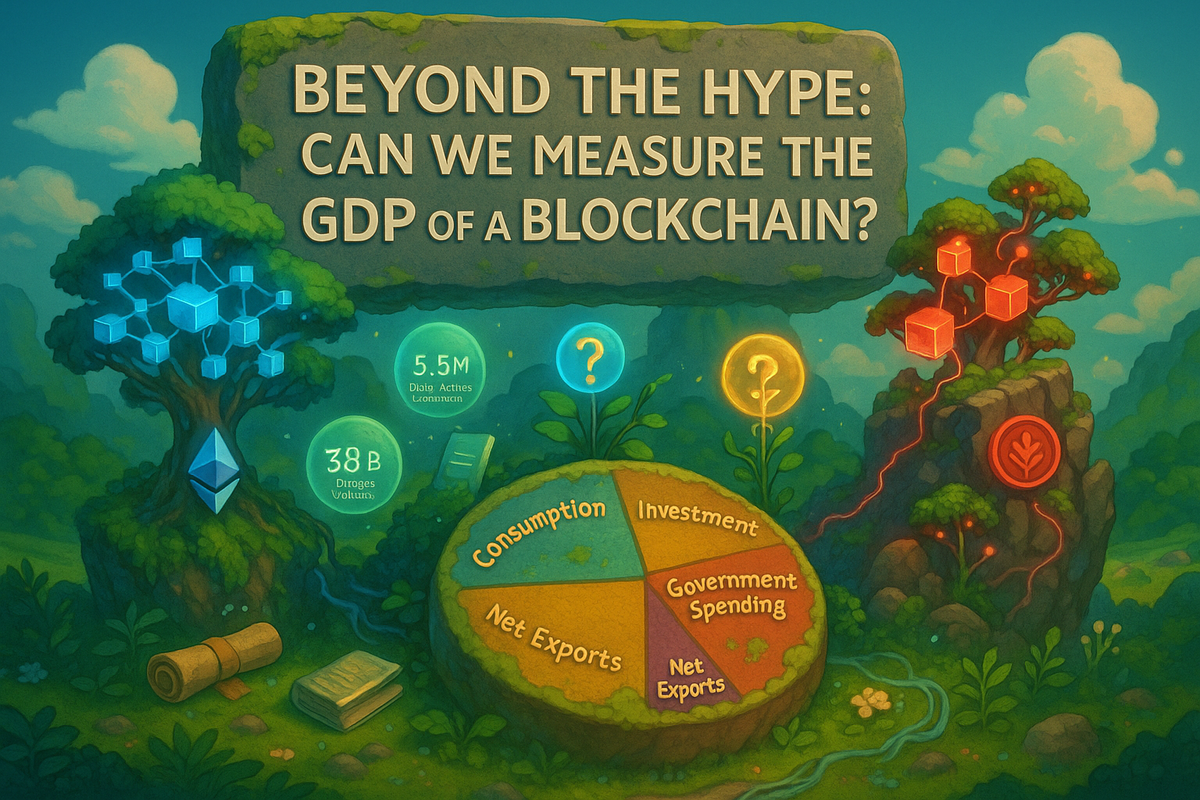
Beyond the Hype: Can We Measure the GDP of a Blockchain?
The Valuation Conundrum
For investors plying their trades in traditional finance(TradFi), the cryptocurrency market often feels like a speculative quagmire, with prices driven by narratives rather than fundamentals. Fidelity Investments, a powerhouse in asset management puts forward a proposal: view blockchains as sovereign "digital economies" and measure their value using a GDP-like framework. In their research paper, Blockchains as Emerging Economies, authors Paul Lang, CFA, and Anaïs Rachel offer a structured approach for institutional investors. Testing its applicability to chains like Ethereum and Solana. But can a macroeconomic framework capture the decentralized, global nature of blockchains, and does it deliver the clarity investors seek?
The Core Thesis: From Software to Sovereign Economies
Fidelity argues that comparing blockchains to software companies is inadequate (Fidelity Institutional). Unlike centralized firms with predictable revenue, blockchains are decentralized networks with native currencies, like Ether (ETH) or Solana (SOL), functioning as "base money" to incentivize participants (Fidelity Institutional). Transaction fees, paid in these currencies, mirror inflation, rising with demand for blockspace—the limited computational capacity of a blockchain’s blocks. Wallet addresses, akin to demographics, reveal consumption patterns, with growing active addresses signaling economic vitality (Fidelity Institutional). For example, Solana’s daily active addresses surged from 4 million to over 5.5 million in Q2 2025, dwarfing Ethereum’s 400,000–700,000, though Solana’s vote transactions inflate this figure (The Block). This nation-state analogy shifts focus from speculative hype to economic fundamentals, resonating with investors accustomed to macroeconomic analysis (Fidelity Institutional).
Deconstructing the Digital Economy: A GDP-like Framework
Fidelity’s GDP-like framework measures a blockchain’s economic activity through four components: consumption, government spending, investment, and net exports (Fidelity Institutional). Applied to Ethereum and Solana, it reveals their economic profiles but struggles with non-productive activity like wash trading, which can inflate metrics (CoinShares). The following table, adapted from the critical assessment report, maps these components to on-chain metrics and highlights their conceptual challenges, providing a clear overview for investors (Fidelity Institutional).
Table 1: Blockchain GDP Framework Mapped to On-Chain Metrics
GDP Component | Traditional Definition | Blockchain Analogue | Key On-Chain Metrics | Data Sources | Conceptual Challenges |
|---|---|---|---|---|---|
Consumption (C) | Household spending on final goods and services | Total transaction fees paid by users | Total Gas/Transaction Fees (USD), Fee breakdown by dApp/sector | YCharts, CoinShares, TokenTerminal | Conflates price with volume; low-fee chains appear less active despite high usage |
Investment (I) | Spending on capital goods for future production | Staked assets and liquidity pools | Staked tokens (ETH/SOL), DeFi TVL | Nansen, Helius | Staking doesn’t create new capacity; may include extractive MEV |
Government Spending (G) | Government expenditure on public services | Token issuance and ecosystem grants | Staking rewards, foundation grants | Galaxy, Helius | Centralized foundation influence lacks user accountability |
Net Exports (X-M) | Exports minus imports of goods and services | Net bridge flows (inbound vs. outbound assets) | Bridge volume (USD) | Cointelegraph, DeFiLlama | Non-productive flows (e.g., CEX rebalancing) inflate metrics |
This table highlights the framework’s attempt to quantify economic activity while exposing its limitations, such as conflating high fees with high value or misinterpreting capital flows as productive trade (Fidelity Institutional).
Consumption
Consumption captures fees paid to access blockchain services, similar to sales taxes or service fees in traditional economies (Fidelity Institutional). On Ethereum, this includes gas fees (costs for transactions, volatile like forex rates), application revenue, and non-fungible token (NFT) sales (Fidelity Investments). In 2024, Ethereum’s fees were 47% from decentralized finance (DeFi), 25% from trading, 6% from arts, and 22% from other activities, reflecting a diversified economy (Fidelity Institutional). Ethereum generated $780.9 million in annual revenue, far exceeding Solana’s $416.1 million, despite Solana’s 162 million daily non-vote transactions compared to Ethereum’s 1.2 million (TokenTerminal). Solana’s low fees (averaging $0.00025) understate its activity in this model, highlighting a flaw: high fees don’t always equal high value. Speculative activities, like NFT wash trading, further distort consumption metrics (CoinShares).
Below is a visualization of Ethereum’s fee distribution, illustrating its economic diversity: source Fidelity Institutional
Government Spending
“Government spending” reflects the blockchain’s expenditure on security and development, similar to a central bank’s role (Fidelity Institutional). On Ethereum, this includes staking rewards and Ethereum Foundation grants ($50 million in 2024). Ethereum’s EIP-1559 burns base fees, linking high usage to deflationary pressure (Galaxy). Similarly, Solana’s issuance schedule functions like a disinflationary fiscal policy, fixed at ~4.66% annually and decreasing by 15% every 180 epochs. Though 50% of fees are burned, Solana’s low transaction costs limit deflationary offset. A recent proposal, SIMD‑0228, aimed to dynamically adjust inflation to maintain staking levels (around 65%) and drastically reduce issuance—but it failed in March 2025 with ~61% support, below the required 66.67%, despite ~74% staked‑supply voter turnout. Opponents cited risks to validator rewards, decentralization, and network security. The vote demonstrated engaged governance, yet monetary policy remains inflexible, reflecting ongoing tension between issuing predictable stake rewards and evolving token dynamics.
Investment
Investment measures capital formation, like staked assets and liquidity pools (Fidelity Institutional). Ethereum’s 29% staking rate and $100 billion DeFi total value locked (TVL) contrast with Solana’s 65% staking rate and $8–9 billion TVL in 2025 (Helius). Unlike factories, staking doesn’t create new capacity, and Maximal Extractable Value (MEV)can make this capital extractive, undermining the analogy (CoinShares).
Net Exports
Net exports track capital flows via cross-chain bridges, with imports (assets entering) and exports (assets leaving) (Fidelity Institutional). Ethereum’s $38 billion bridge volume in Q4 2024–Q1 2025 dwarfs Solana’s $10.1 billion, reflecting Ethereum’s role as a liquidity hub (Cointelegraph). Solana’s bridge volume grew 114% in 2024, driven by stablecoin USDC (Cointelegraph). Tokenization, like patents on Ethereum for transparent ownership, and DePIN, like Helium’s decentralized wireless network on Solana, enhance this component (Fidelity Institutional). However, non-productive flows, like exchange wallet rebalancing, inflate metrics without economic substance (Fidelity Institutional). Regulatory bans on stablecoins could disrupt this, a key risk (Fidelity Institutional).
A Critical Perspective: Testing the Analogy
Fidelity’s framework is compelling but flawed. Blockchains’ global, permissionless nature defies nation-state boundaries. The productivity problem equating a $10 fee for a DeFi protocol with a $10 MEV bot attack—undermines its validity, as does wash trading inflating NFT volumes (CoinShares). For example, a user creating 1,000 wallets to farm a Solana airdrop (a sybil attack) inflates active addresses without economic value, a “garbage-in, garbage-out” issue (Fidelity Institutional). Solana’s priority fees mitigate spam, but challenges persist (CoinsBench). The unit of account fallacy notes that stablecoins like USDC, with $12 trillion in 2024 transfer volume, dominate pricing over volatile ETH or SOL. Ethereum’s ERC-4337 allows fee payments in stablecoins, reducing native token demand (Fidelity Institutional). Governance risks persist, as foundations lack user accountability (Fidelity Investments).
Alternative valuation frameworks provide contrast, as summarized in the following table from the critical assessment report, which compares the Blockchain GDP model to network-centric, cash-flow-centric, and fundamentals-based approaches (Fidelity Institutional). This highlights their strengths, limitations, and best use cases for investors.
Table 2: Comparative Analysis of Crypto-Asset Valuation Models
Model | Core Principle | Data Inputs | Pros | Cons | Best Use Case |
|---|---|---|---|---|---|
Blockchain GDP | Values network as an economy | Transaction fees, staking, bridge flows | Structured macroeconomic lens | Conflates capital movement with production | Monitoring ecosystem health |
Metcalfe’s Law | Value ~ users² | Active addresses | Captures network effects | Assumes equal user value | Assessing adoption trends |
NVT Ratio | Market cap/transaction volume | Transaction volume, market cap | Flags speculative bubbles | Distorted by non-economic activity | Relative valuation |
DCF | Values future cash flows | Fees, staking rewards | Links revenue to value | Sensitive to assumptions | Fundamental valuation |
Fundamentals | Developer/user engagement | Code commits, retention rates | Gauges long-term vitality | Qualitative, hard to quantify | Ecosystem sustainability |
This table highlights the GDP model’s utility as a health dashboard rather than a valuation tool, while DCF and fundamentals-based models offer complementary insights (Fidelity Institutional)
Chris Burniske’s discounted cash flow (DCF) model projects cash flows from fees and staking, estimating SOL’s value at $646.65 in Q1 2025 (21shares). The Equation of Exchange (MV=PQ) links a token’s market cap (M) to economic activity (PQ) and velocity (V), but struggles with velocity estimation (Medium). Vitalik Buterin emphasizes user growth, aligning with Metcalfe’s Law (value ~ users²), yet ignores output quality (Morpher). The Network Value-to-Transactions (NVT) ratio (market cap/transaction volume) flags speculative bubbles but falters with non-economic activity (Medium). Qualitative metrics, like Ethereum’s 28,400+ GitHub commits vs. Solana’s 1,500 in 12 months ending in mid-2025, reflect developer momentum (Coingecko). In my view, the discussions around valuation models show that GDP-based approaches can overcomplicate things. I believe developer activity and user retention are more meaningful indicators of long-term value. While I appreciate the holistic nature of Fidelity’s framework, I think it risks misrepresenting low-fee networks like Solana.
Below is a comparison of implied values from DCF and GDP models, highlighting discrepancies:
The Role of Money and Monetary Policy in the Digital Realm
Native currencies like ETH and SOL serve as units of account, mediums of exchange, and stores of value (Fidelity Institutional). ETH dominates Ethereum’s trading (74% volume in 2024) and lending (31% deposits) (Fidelity Institutional) Critics claim cryptocurrencies fail as money since “you can’t buy a coffee” with them. Fidelity counters that currencies are context-specific: yen isn’t accepted in U.S. cafés, and ETH governs Ethereum’s digital commons. Stablecoins like DAI, backed by ETH, extend utility (Fidelity Institutional). Yet, stablecoins’ dominance undermines native tokens as units of account (Fidelity Institutional).
Ethereum’s programmatic monetary policy, via EIP-1559, burns fees during high demand, reducing supply. Post-Dencun (2024), fees dropped from 0.015 ETH to 0.003 ETH, increasing issuance (YCharts). Solana’s fixed disinflation (4.661% annually, decreasing 15% every 180 epochs) is predictable but unresponsive to activity, limiting value accrual, as evidenced by the SIMD-0228 proposal’s failure to introduce dynamic adjustments (Helius, Ainvest). Ethereum’s proof-of-stake contrasts with Solana’s proof-of-history, which prioritizes speed but risks centralization. Regulatory shifts could impact both.
Forward-Looking Conclusion: A New Lens for a New Asset Class
Fidelity’s framework offers a structured lens, but the new report reveals its limits as a valuation tool (Fidelity Institutional). It’s better as a health dashboard, tracking fee diversity, staking growth, and bridge flows. Investors should monitor metrics like Solana’s 7,600 new developers (Helius, Cointelegraph). Layer 2 solutions, like Arbitrum’s $10+ billion TVL in 2025, drive Ethereum’s economy but complicate GDP calculations, requiring aggregated L1/L2 data to capture activity like Arbitrum’s 50 million monthly transactions (Wellington Management, CoinShares). Diversified fees (e.g., Ethereum’s 40% DeFi, 30% trading) signal resilience, while Solana’s 81% DEX volume highlights trading dominance (Fidelity Institutional, Alinvest). Tokenization of real-world assets (e.g., bonds) and DePIN growth, like Helium’s wireless network, could drive net exports, integrating blockchains with global economies (Wellington Management). Solana’s tokenized assets surged 140.6% to $418 million in 2025, narrowing the gap with Ethereum’s 58.4% RWA market share.
Governance and tokenomics are critical. Solana’s rejection of SIMD-0228, with nearly 50% voter turnout, reflects strong community governance but limits monetary flexibility, while Ethereum’s transparent burn mechanism boosts investor confidence. Risks—SEC scrutiny of DeFi, Solana’s 2024 outage, speculative bubbles, and governance centralization persist (Fidelity Institutional). A mosaic approach, interfusing DCF for cash flows, Metcalfe’s Law for user growth, and qualitative metrics like developer retention, offers a path forward. Investors should overweight chains with high developer retention and diversified revenue, hedging regulatory risks by allocating across L1s and L2s, such as Ethereum and Arbitrum, to balance growth and stability . The following data compares key economic indicators for Ethereum and Solana, highlighting their divergent models Ethereum as a high-security settlement layer, Solana as a high-throughput trading hub.
As blockchains evolve, Fidelity’s framework, despite flaws, equips investors to assess digital economies’ long-term viability in a volatile, transformative terrain.
References
- Fidelity Institutional. Blockchains as emerging economies. Fidelity Institutional Wealth Management Services. https://institutional.fidelity.com/app/proxy/content?literatureURL=9919383.PDF
- YCharts. Ethereum Average Transaction Fees, Real-Time & Historical. https://ycharts.com/indicators/ethereum_average_transaction_fee
- Coinbase Help. What is EIP-1559?. https://help.coinbase.com/en/coinbase/getting-started/crypto-education/eip-1559
- CoinShares. Ethereum transaction fee report - Q4 2024. https://coinshares.com/be/insights/research-data/ethereum-transaction-fee-report-q4-2024/
- Helius. Solana Ecosystem Report (H1 2025) - Earnings Growth. https://www.helius.dev/blog/solana-ecosystem-report-h1-2025
- Galaxy. EIP-1559: A Major Upgrade for Ethereum. https://www.galaxy.com/insights/research/eip-1559-major-ethereum-upgrade
- Cointelegraph. Solana bridges reach $10.1B all-time inbound volume. https://cointelegraph.com/news/solana-bridge-all-time-inbound-volume-10-billion
- 21Shares. Crypto for everyone. https://www.21shares.com/en-eu/research/primer-on-crypto-asset-valuations-q1-2025
- Morpher. Metcalfe's Law in Crypto: How User Growth Drives Value. https://www.morpher.com/blog/metcalfes-law
- Medium. Today's Crypto Asset Valuation Frameworks. https://medium.com/@cburniske/cryptoasset-valuations-ac83479ffca7
- Alinvest. Solana Leads dApp Revenue with $146 Million in June 2025. https://www.alinvest.com/news/solana-leads-dapp-revenue-146-million-june-2025-2507/
- The Block. Ethereum On-Chain Data and Charts for Transactions, Fees and Network Activity. https://www.theblock.co/data/on-chain-metrics/ethereum
- TokenTerminal. Revenue - Solana. https://tokenterminal.com/explorer/projects/solana/metrics/revenue
- Wellington Management. Evaluating cryptocurrencies as an asset class. https://www.wellington.com/en/insights/evaluating-cryptocurrencies-asset-class
- Ainvest. Solana Inflation Reduction Proposal Fails, Record Voter Turnout. https://www.ainvest.com/news/solana-inflation-reduction-proposal-fails-record-voter-turnout-2503/

Comments ()