Massive Bull Run Ahead? Chart Patterns Point to BTC’s Next Leg Up
Here’s an in-depth look at why two classic chart patterns—the weekly MACD bear-trap and the impending golden-cross—are flashing bullish signals for Bitcoin’s next leg up. Both formations echoed those seen before the late-2024 rally from $70 K to $109 K, suggesting a repeat surge may be underway. We’ll unpack each setup, explore complementary patterns like bull flags, and discuss how this technical backdrop aligns with broader market catalysts. Along the way, you’ll find links to key glossary terms and related Market Insights articles to deepen your understanding.
Introduction
Bitcoin has already impressed in 2025—reclaiming $100 K amid macro tailwinds and on-chain strength Investopedia. Yet technical traders are now eyeing two specific formations that mirror the setups recorded just before last year’s massive rally CoinDesk. If history holds, these patterns could propel BTC toward new highs beyond January’s $109 K peak.
In this article, you’ll learn:
- Why the weekly MACD “bear trap” sets the stage for upside
- How a recent death-cross may flip into a golden-cross
- What other chart tools (like bull flags) and macro factors mean for BTC
Let’s dive in.
1. Weekly MACD Bear Trap: Momentum Turning Positive
What Happened in 2024
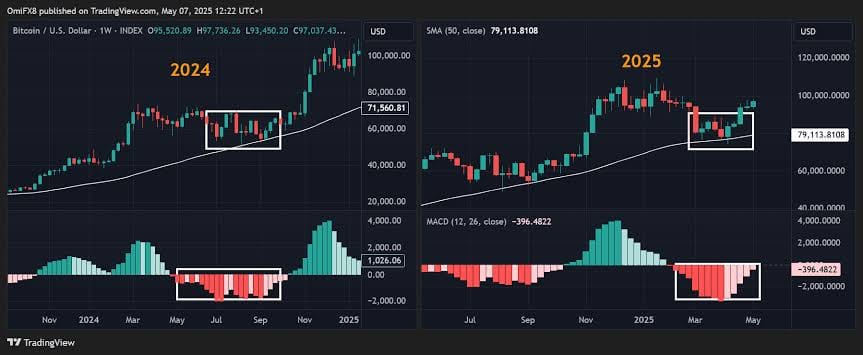
- In August–September 2024, Bitcoin’s weekly Moving Average Convergence Divergence (MACD) histogram stayed below zero—even as price found support at the 50-week Simple Moving Average (SMA) CoinDesk.
- That apparent bearish crossover lured sellers, only for BTC to reverse and surge from $70 K to $100 K by year-end.
Today’s Echo
- The weekly MACD recently flipped negative again in mid-February—but price held firm at the same 50-week SMA support, then rebounded above $90 K CoinDesk.
- A similar bear-trap dynamic is playing out: bearish momentum readings paired with healthy price action hint that buyers remain in control.
Refresh on the MACD indicator and the 50-week SMA.
2. From Death Cross to Golden Cross: A Bullish Flip
The Death Cross as a Bear Trap
- Roughly four weeks ago, BTC’s 50-day SMA fell below its 200-day SMA, forming a classic death cross—typically viewed as a long-term bearish sign CoinDesk.
- However, Bitcoin bounced near $75 K, trapping bears in a false breakdown.
Golden Cross on the Horizon
- Now the 50-day SMA is climbing toward the 200-day SMA—and a golden cross (50 > 200) could occur in the coming weeks CoinDesk.
- Historically, a golden cross has signaled sustained bull markets: the short-term average crossing above the long-term average suggests a definitive upward trend Investopedia.
🔗 Learn more about the death cross and golden cross patterns.
3. Complementary Patterns & Volume Signals
Bull Flags & Pennants
- Short-term continuation patterns—like bull flags and pennants—also abound on BTC’s daily charts, indicating consolidation before another leg up TradingView.
- A breakout from these formations typically measures the flagpole’s length projected upward.
Supporting Volume & RSI
- Volume trends and momentum oscillators like the Relative Strength Index (RSI) are confirming bullish conviction.
- For instance, despite overbought RSI readings, healthy dips and volume spikes on pullbacks suggest strong hands are accumulating Investopedia.
🔗 Brush up on bull flags and RSI via our glossary.
4. Macro Tailwinds & Market Context
Institutional & Regulatory Catalysts
- U.S. institutions are reportedly building Bitcoin reserves, and regulatory clarity on spot ETFs continues to improve—setting a supportive macro backdrop Investor's Business Daily.
- Even on-chain metrics show rising whale activity alongside network health, reinforcing technical signals TronWeekly.
Historical Cycle Alignment
- Crypto’s four-year halving cycle suggests 2025 may echo prior bull years—without the same macro headwinds of 2021 and 2024 Investing Haven.
- Long-term price projections span $77 K to $155 K by year-end, underscoring broad bullish sentiment across models Investing Haven.
Conclusion & Takeaways
Bitcoin’s charts are flashing familiar setups—weekly MACD traps and a potential golden cross—not seen since just before last year’s $109 K breakout. When combined with supportive volume, bull-flag continuations, and healthy macro catalysts, the technical case for a fresh leg up is compelling.
Practical Steps:
- Watch for the golden cross confirmation on the 50/200-day SMAs.
- Target bull-flag breakout levels, measuring the flagpole for price objectives.
- Monitor volume and RSI for signs of accumulation vs. distribution.
What’s your view? Are these chart patterns enough to bank on BTC’s next all-time high? Share your thoughts in our Market Insights contributor chat!
Internal Links
- MACD glossary entry
- Golden Cross glossary entry
- Market Insights category
- Liquidity TVL Glossary
- Expedition Boosts
- Straddle Vault
- Mitosis University
- Mitosis Blog.
- Mitosis Core: Liquidity Strategies.
Citations
- Massive Bitcoin Bull Run Ahead? Two Chart Patterns Mirror BTC’s Rally to $109K CoinDesk
- Bitcoin surged past $100 K, driven by macro catalysts and RSI signals Investopedia
- Analysts target $225 K by end-2025 amid institutional demand and regulatory progress Investor's Business Daily
- Bull flags and pennants as bullish continuation patterns TradingView
- Crypto bull cycles and institutional flows TronWeekly
- Price predictions for 2025 range from $77 K to $155 K Investing Haven
- Golden cross confirms major bull markets, death cross signals bears Investopedia
- Death cross explained: 50-day MA crosses 200-day MA, often trapping bears Investopedia
- Golden cross vs. death cross overview and limitations Encyclopedia Britannica
- Bullish pennant and flag definitions and targets changelly.com


Comments ()