Mastering Fibonacci Retracement: A Powerful Tool in Technical Analysis

Successful investing in financial markets is not left to chance. Therefore, investors use a variety of technical analysis tools to predict price movements and develop appropriate strategies. Among these tools, the Fibonacci retracement method stands out with its mathematical origins and practical applications. It is frequently used by both beginners and experienced traders to identify critical support and resistance levels on price charts.
In this article, we will explore the concept of Fibonacci retracement in detail, explain how it is calculated, how it is used in market analysis, its advantages and disadvantages, and demonstrate how it can be applied with real-world examples.
What Is Fibonacci Retracement?
Fibonacci retracement is a technical analysis tool used to predict where the market might pause or reverse after a price movement. This method assumes that prices tend to retrace by certain percentages. These percentages are derived from a sequence of numbers identified by the mathematician Leonardo Fibonacci in the 13th century.
Fibonacci Sequence and Ratios
The Fibonacci sequence starts with 0 and 1, and each subsequent number is the sum of the two preceding ones:
0, 1, 1, 2, 3, 5, 8, 13, 21, 34, 55, 89, 144, 233, ...
The ratios derived from this sequence are used in technical analysis to determine potential retracement levels of price movements. The most commonly used Fibonacci ratios are:
- 23.6%
- 38.2%
- 50% (technically not a Fibonacci ratio but widely used)
- 61.8%
- 78.6%
- 100%
These ratios are considered important support or resistance zones within price ranges.
How Is Fibonacci Retracement Calculated?
The mathematical principle behind Fibonacci ratios involves the division of two consecutive Fibonacci numbers. In the higher numbers of the sequence, dividing a number by the next one yields approximately 0.618 (61.8%), known as the "Golden Ratio." Similarly, dividing a number by the number two places to the right yields approximately 0.382 (38.2%).
These ratios indicate the levels at which price movements are likely to retrace on the chart. For example, after an upward trend, the price often retraces to the 61.8% level, which may act as a strong support area.
The Role of Fibonacci Retracement in Financial Markets
The Fibonacci retracement tool is widely used across stocks, forex, and cryptocurrencies. Particularly in highly volatile markets like cryptocurrencies, traders frequently use this tool to better understand price pullbacks.
Applying Fibonacci on Charts
Typically, the Fibonacci tool is drawn between the low and high points of the price. This way, potential retracement levels within the market are clearly visible. For example, if Bitcoin’s price rises from $20,000 to $30,000, drawing the Fibonacci tool between these points will show the 38.2% level at approximately $26,180, which may act as a potential support zone during a price pullback.
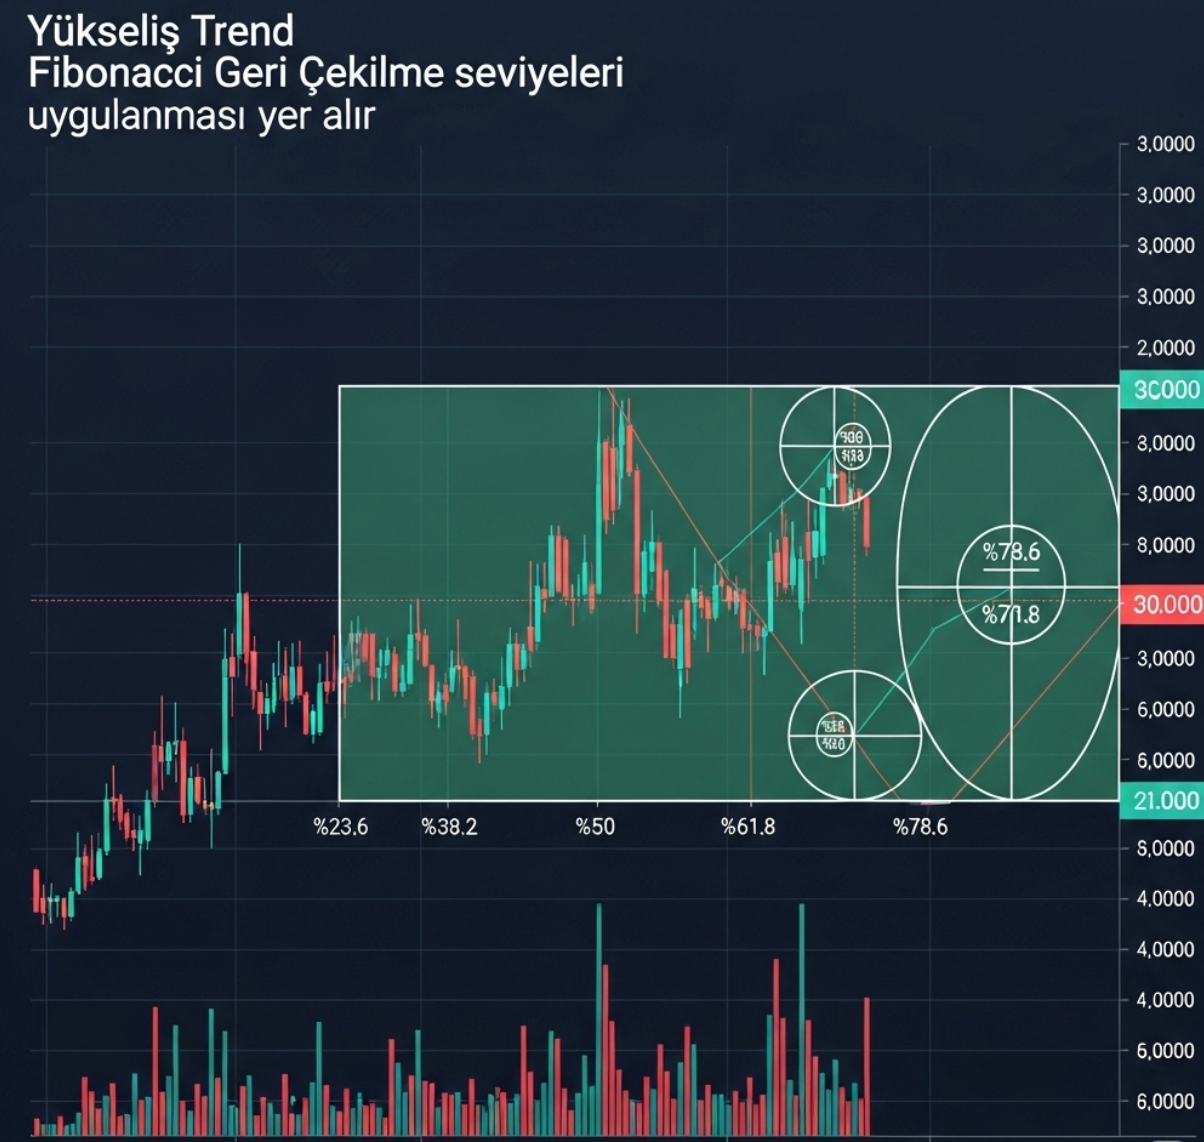
Use in Uptrend and Downtrend
- In an uptrend: The tool is drawn from the lowest price point to the highest point. It helps identify where the price may find support during retracements.
- In a downtrend: The tool is drawn from the highest price point to the lowest. It helps determine potential resistance levels if the price starts to move upward.
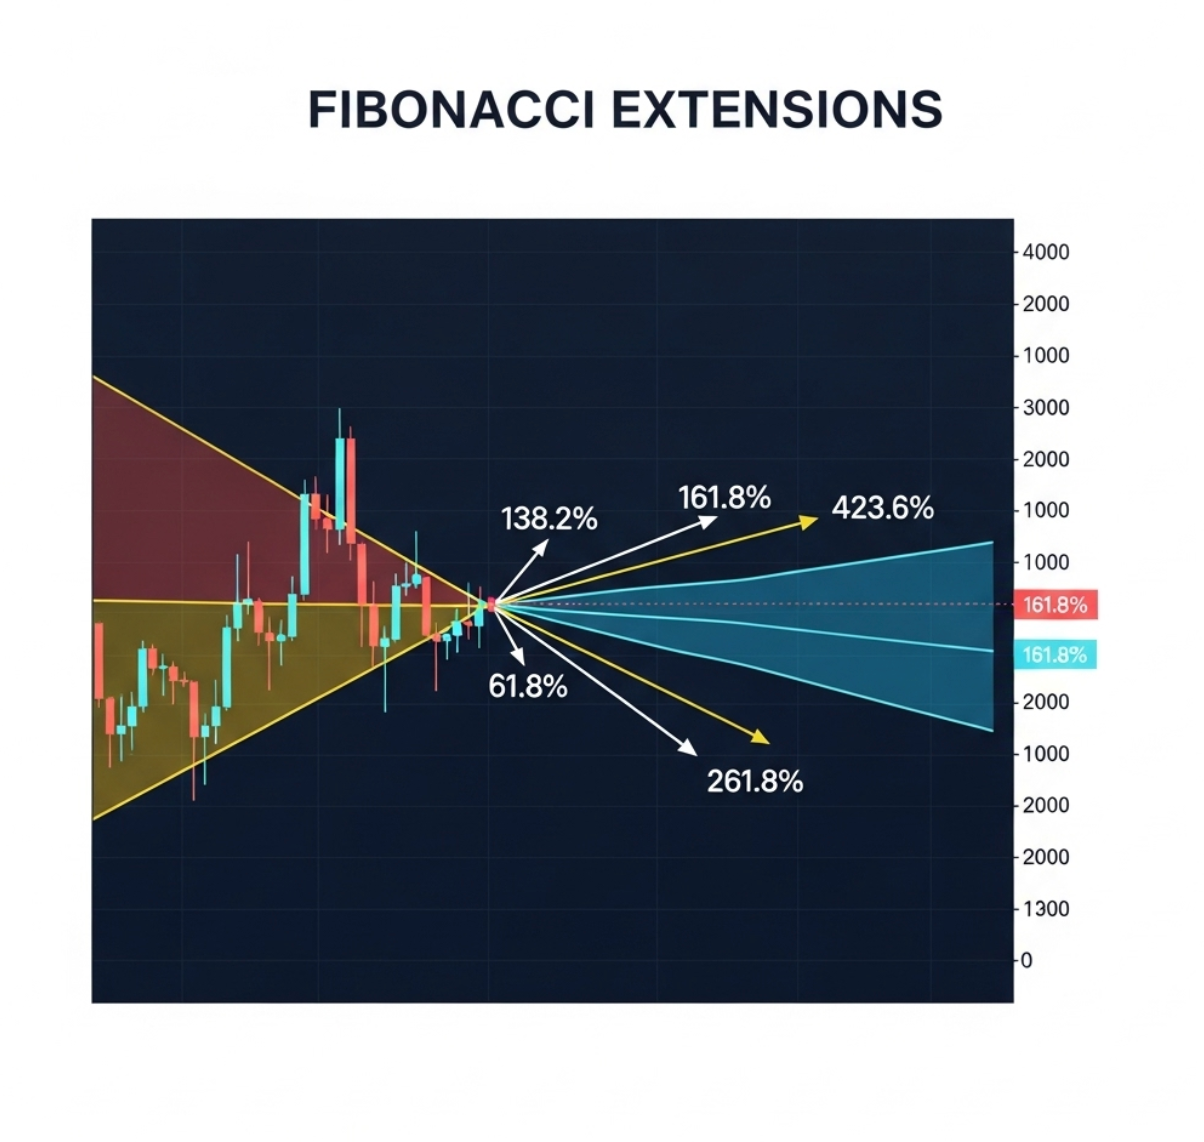
Fibonacci Extensions: Setting Price Targets
Fibonacci is not only used to identify retracement levels but also to project future potential price levels beyond the current range. These are called Fibonacci extensions.
Common extension levels include:
- 138.2%
- 150%
- 161.8%
- 261.8%
- 423.6%
For example, if the price bounces from the 61.8% retracement level and starts rising, traders might target the 138.2% or 161.8% levels as profit-taking zones. These extensions provide an estimate of where the next price movements might end.
Fibonacci in Nature and Art
The Fibonacci sequence and the Golden Ratio appear widely outside of finance. In nature, they describe patterns such as the arrangement of leaves, the spiral of shells, and even the shape of galaxies. In art, structures like the Pyramids, Leonardo Da Vinci’s works, and modern graphic designs incorporate the Golden Ratio.
This universality underlines the psychological and structural significance of Fibonacci ratios in financial markets. Human preference for certain proportions and symmetry can translate into important support and resistance levels in price movements.
Fibonacci Retracement Strategies
1. Identifying Support and Resistance
Retracement levels often act as support or resistance. For example, in an uptrend, the price approaching the 61.8% level might find strong support. Conversely, in a downtrend, this level might act as resistance.
2. Determining Entry and Exit Points
Traders use Fibonacci levels to plan entry and exit points. For instance, buying near the 38.2% retracement and selling near the 23.6% level can be an effective strategy. Of course, this depends on individual strategy and other technical factors.
3. Setting Stop Loss Levels
Fibonacci levels help manage risk by placing stop-loss orders just below support or above resistance levels. This protects positions against sudden adverse price movements.
4. Combining with Other Indicators
Fibonacci retracement is most effective when combined with indicators like RSI, MACD, or moving averages. For example, if the RSI indicates oversold conditions near a 61.8% retracement, this combined signal may suggest a strong buying opportunity.
Limitations of Fibonacci and Important Considerations
While Fibonacci retracement is a valuable tool, it is not infallible. Markets are complex and influenced by numerous factors, so these levels do not always hold, and prices can break through them.
Therefore:
- Fibonacci analysis should not be used in isolation.
- It should be supported by other technical and fundamental analysis tools.
- Risk management strategies must always be applied.
Real-World Example: Bitcoin and Fibonacci
In 2021, Bitcoin reached nearly $64,000 and then experienced significant pullbacks. Traders used Fibonacci levels to track these retracements. The 61.8% retracement level, around $40,000, acted as strong support, where buyers re-entered the market. This example highlights the technical and psychological importance of Fibonacci levels in the market.
Conclusion: Enhance Your Technical Analysis Skills with Fibonacci
Fibonacci retracement is an indispensable tool for traders trying to make sense of complex market movements. With its mathematical foundation and universality in nature, this method holds a unique place among technical indicators. When used correctly and with discipline, it can form a core part of successful trading strategies.
However, always consider market dynamics, other technical indicators, and macroeconomic factors. Learning to apply Fibonacci tools on charts will significantly improve your investing skills


Comments ()