Simple Explanation: What is the Double Top and Double Bottom Chart Pattern? 📉📈

If you've started looking at market charts, you've probably heard terms like "double top" or "double bottom". These are very important chart patterns in the investment world. But remember, when read correctly, they can lead to great results, but if misinterpreted, they can cause significant losses.
In this article, I will explain double top and double bottom patterns in the simplest way. It’s like explaining it to a friend... Avoiding complex terms, in a way everyone can understand. Let’s dive in!
🔍 First, Let’s Understand What Patterns Are?
Patterns refer to specific shapes that repeat on price charts. These shapes give clues about what the market might do next. So, chart reading is actually about trying to predict the future, much like checking the weather before deciding whether to bring an umbrella.
📉 What is the Double Top Pattern?
Imagine this: a price chart forms the shape of the letter "M". This is the double top pattern. It indicates that the price tried to go up twice but failed to stay there.
The double top pattern generally indicates:
- The rise might be coming to an end.
- Sellers are starting to exert pressure on the market.
- A reversal may be near, meaning a potential decline could start!
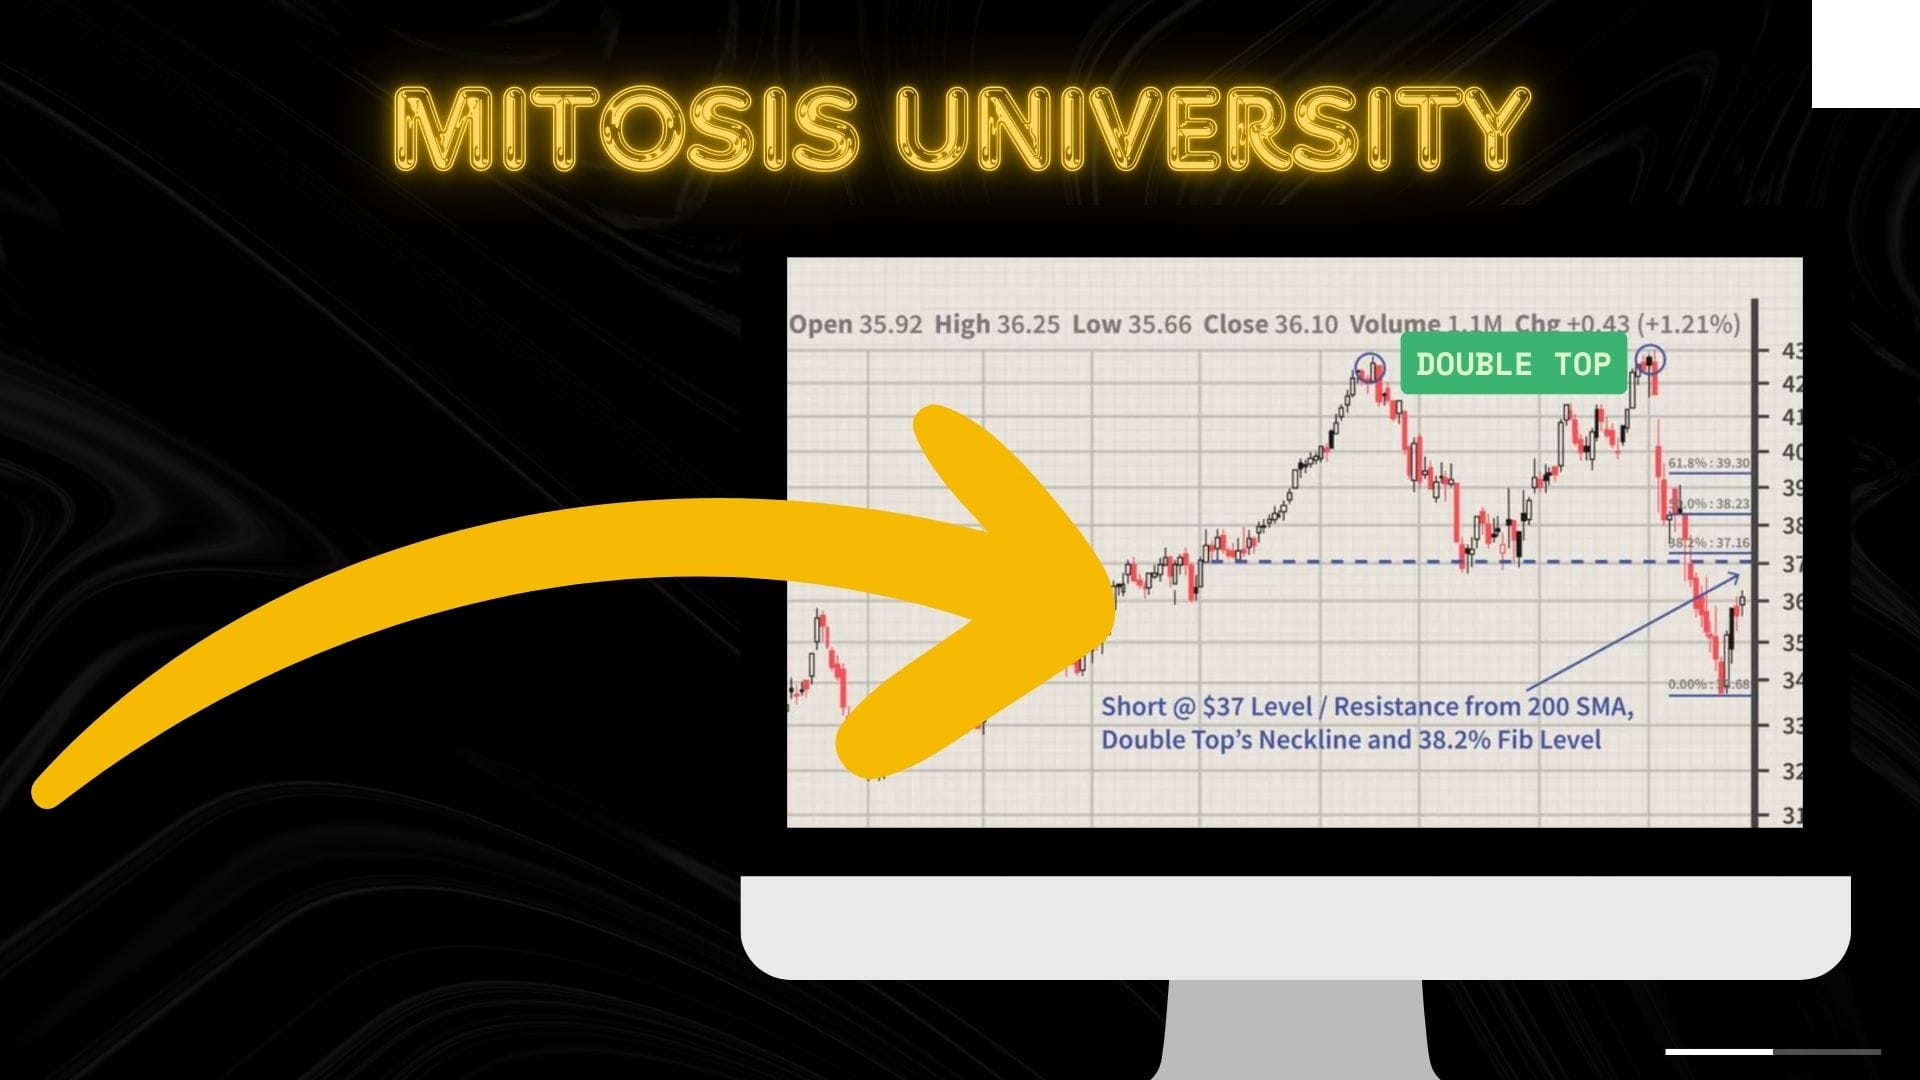
How to Recognize It?
The chart will show two peaks that are nearly the same height, with a small dip (a decline) in between. The second peak is usually a bit lower than the first one. This shows that the market is losing strength.
📌 Quick Info: Double top = possible “sell signal.”
📈 What is the Double Bottom Pattern?
Now, think of the opposite: the chart forms the shape of the letter "W". This is the double bottom pattern. It usually occurs after a long period of price decline.
The double bottom pattern indicates:
- The market has stopped falling.
- Buyers are starting to take control.
- A potential reversal may be on the way, meaning an upward trend could start!
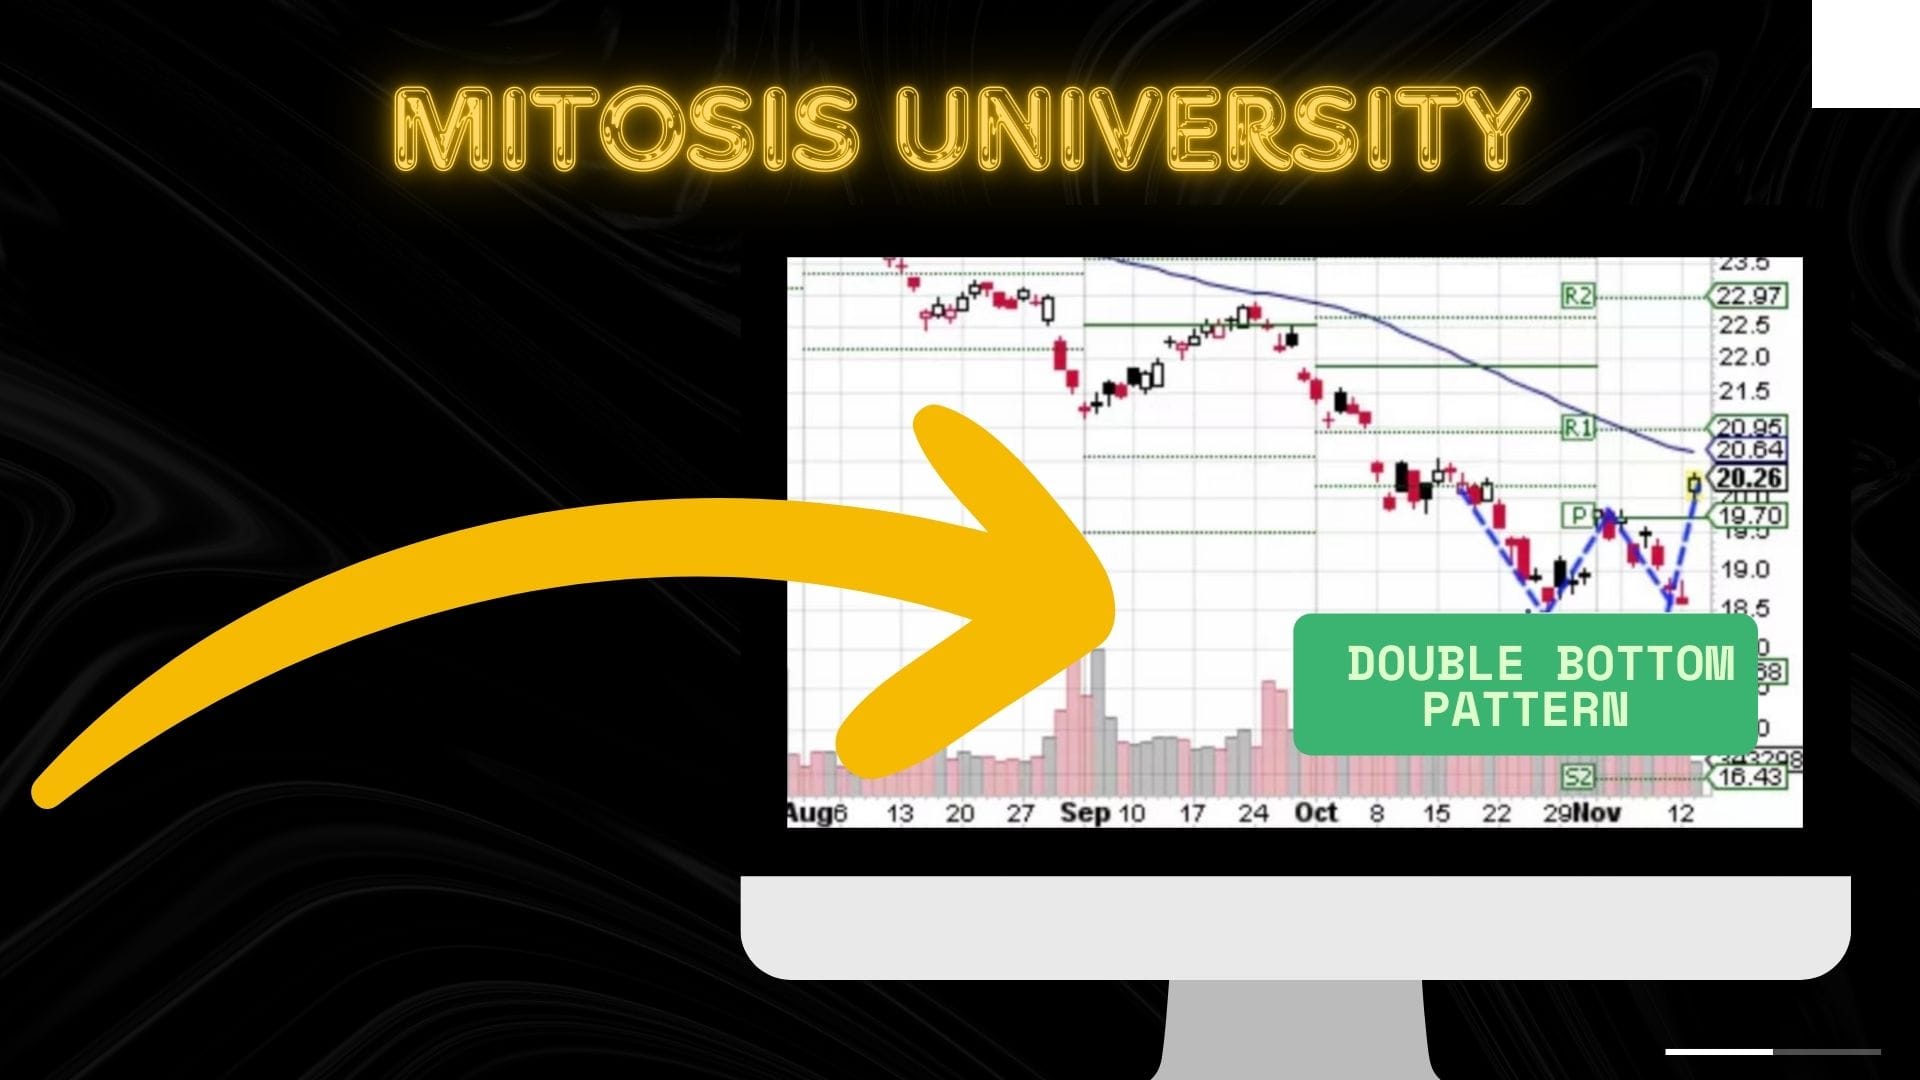
How to Recognize It?
The chart will show two bottoms that are very close to each other. In between, there will be a small rally (rise). If the price starts rising quickly after the second dip, it’s a possible “buy signal.”
📌 Quick Info: Double bottom = possible “buy signal.”
🧠 Why Are These Patterns Important?
Because everyone is looking at charts. A trader who knows how to read these patterns can spot potential price reversals before they happen. This helps them make better buy and sell decisions.
But remember! Not every "M" shape means a fall, and not every "W" shape means a rise. They can be misleading. That’s why you should never rely on just one indicator, but instead use other tools for technical analysis to make better decisions.
🧭 Conclusion: Be Slow, Patient, and Careful
Double top and double bottom patterns are widely used in cryptocurrency, stock markets, and even forex. But these tools require skill. You need time to learn how to spot them and use them correctly.
If you master these patterns, you will feel much more confident in the market. But always remember: Don’t rush. Reading charts takes time. Give yourself time to learn

Comments ()