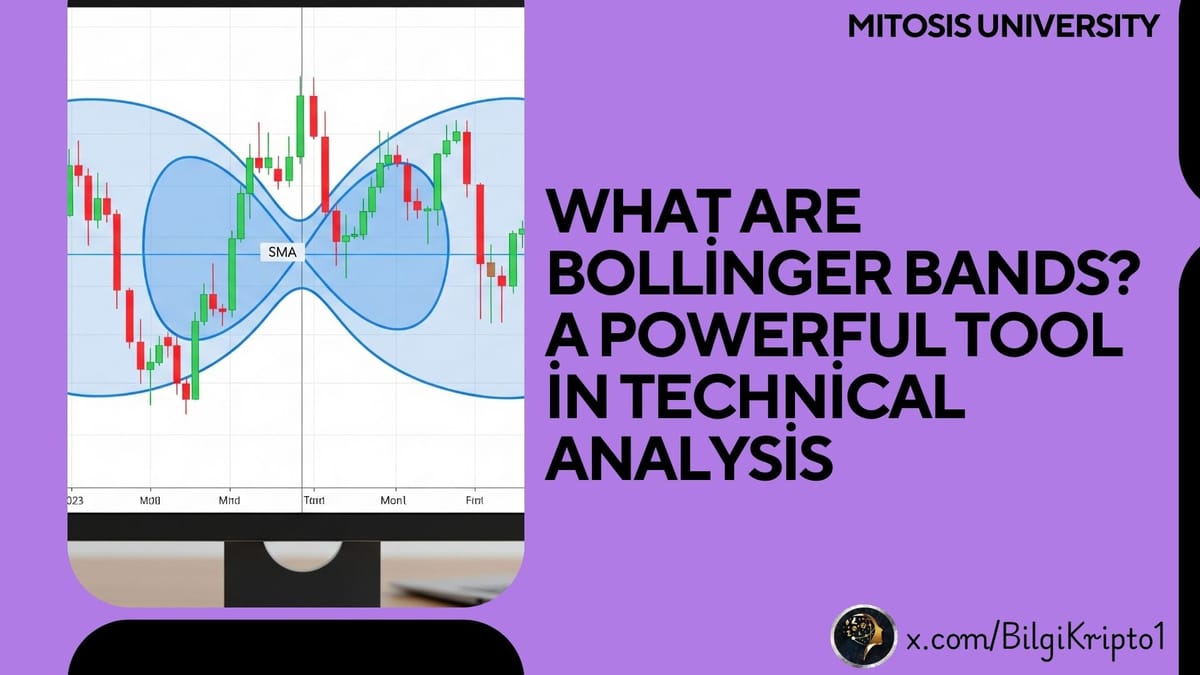
What Are Bollinger Bands? A Powerful Tool in Technical Analysis
Bollinger Bands are among the widely used technical indicators in analyzing price movements in financial markets. Developed in the early 1980s by the famous financial analyst John Bollinger, this tool plays an effective role especially in determining market volatility levels and potential overbought or oversold conditions. Bollinger Bands help investors and traders better understand current price behavior, manage their risks, and make strategic decisions.
The Basic Structure and Functioning of Bollinger Bands
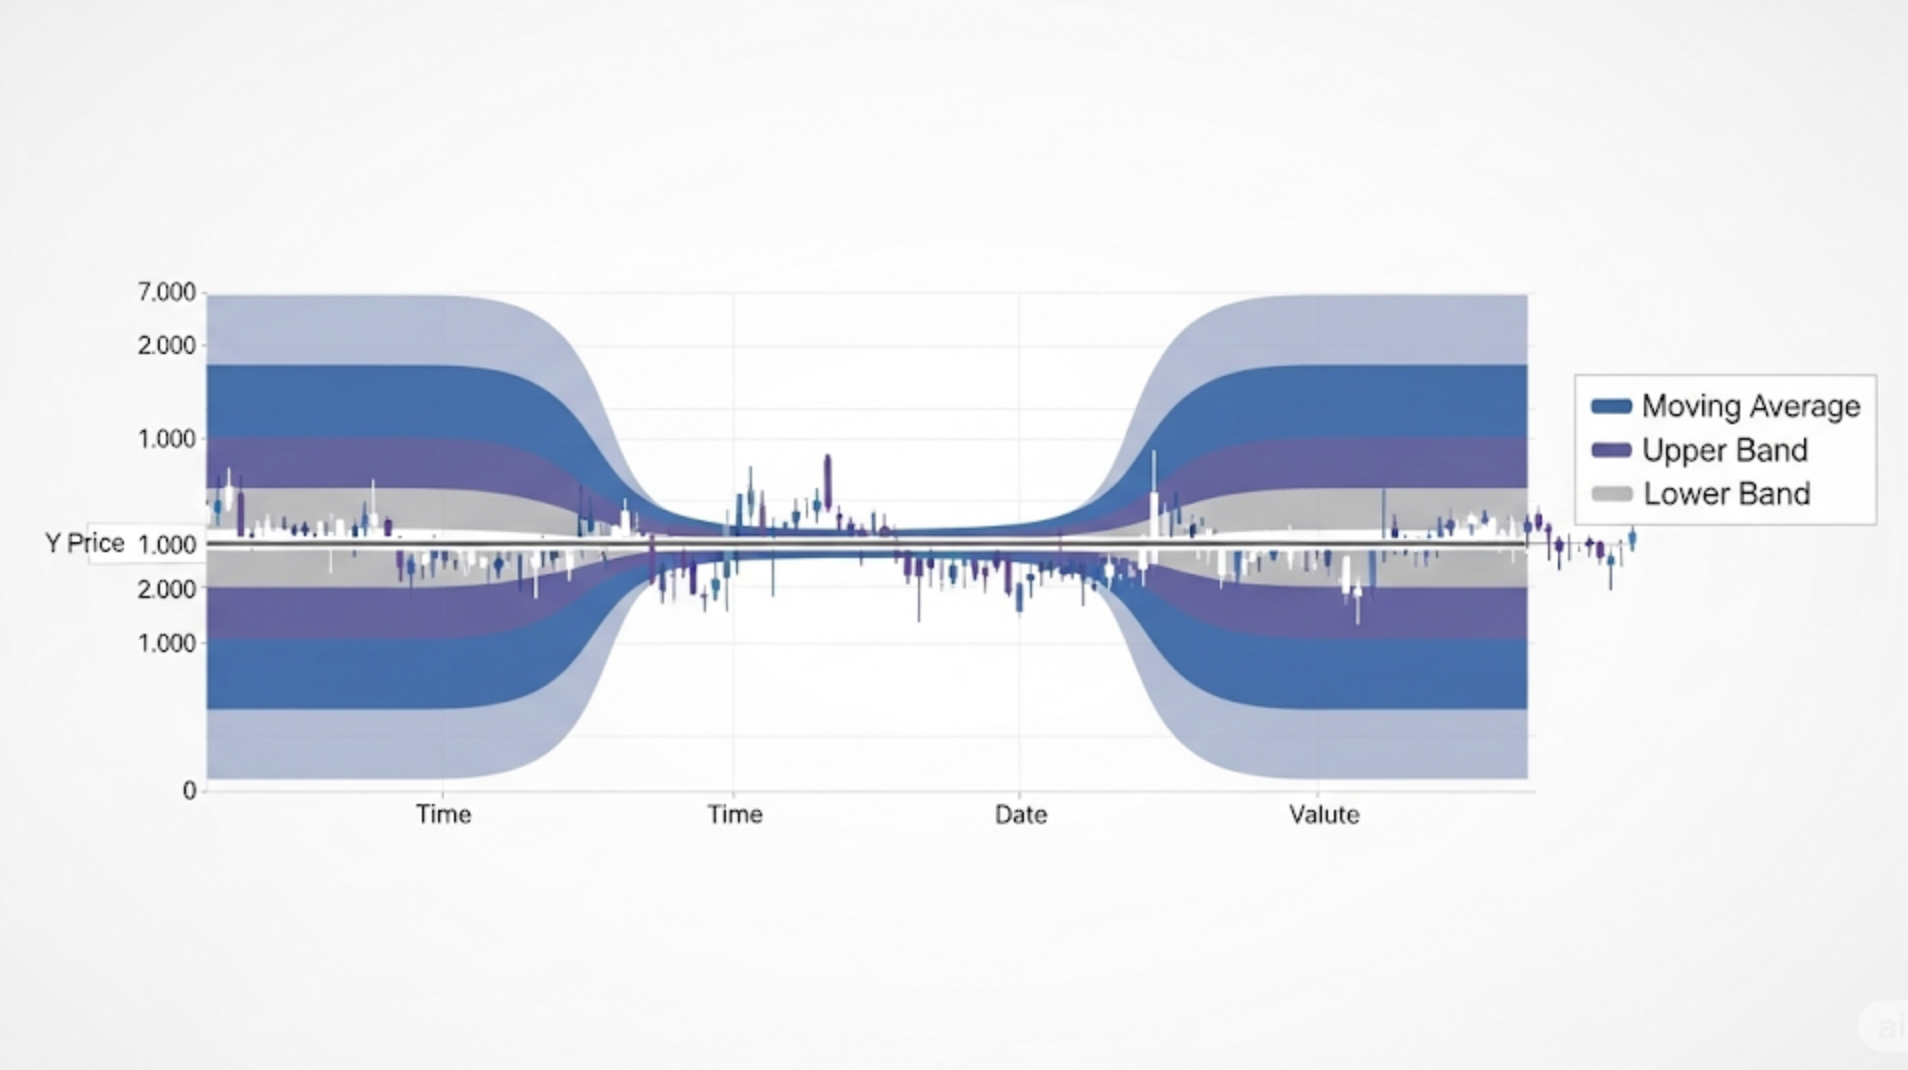
Bollinger Bands consist of three components:
- Middle Band: Typically, a 20-day Simple Moving Average (SMA) is used. This band represents the average level of prices.
- Upper Band: Calculated by adding a certain number of standard deviations above the middle band. Standard deviation measures the dispersion of prices around the average and indicates market volatility.
- Lower Band: Calculated by subtracting a certain number of standard deviations below the middle band.
In classical Bollinger Bands settings, the upper and lower bands are placed two standard deviations away from the middle band. This means approximately 85-90% of price data is expected to move between these bands.
In summary, when market volatility rises, the bands widen; when volatility decreases, the bands contract. This movement is very useful for understanding how volatile the price currently is.
How to Interpret Bollinger Bands? Usage Areas and Examples
Bollinger Bands alone are not sufficient to give buy or sell signals but produce strong results when combined with other technical analysis tools. Here are common uses and explanations with examples:
1. Overbought and Oversold Conditions
- When Price Touches the Upper Band: If the price approaches or exceeds the upper band, it can indicate the asset is overbought or temporarily overextended. For example, if a stock price repeatedly touches the upper band, traders might view this as a potential resistance level.
- When Price Touches the Lower Band: If the price approaches or falls below the lower band, the asset might be oversold or have found a strong support level. This can be interpreted as a buying opportunity.
Example: Suppose Bitcoin’s price stays near the lower band and even dips below it several times. This indicates heavy selling pressure but also suggests the price may have reached a support area where it could bounce back.
2. Band Expansion and Contraction
- Expansion: Widening of the bands indicates increasing volatility and potential for large price movements. For example, when sudden news causes rapid price changes, the bands move further apart.
- Contraction (Squeeze): Narrowing of the bands indicates decreased volatility and a calm market. These periods often precede significant price moves.
3. Bollinger Band Squeeze Strategy
When bands narrow significantly, it is called a “Bollinger Band Squeeze” and represents periods of low volatility. This usually signals that the price is preparing for a major breakout either upward or downward.
Example: Ethereum’s price is tightly compressed within the bands. Traders may wait in such conditions and enter positions when the price breaks out of the bands.
4. Support and Resistance Levels
The upper and lower bands act as dynamic support and resistance levels derived from the moving average. Approaching these bands suggests potential price reactions at these levels.
Bollinger Bands vs. Keltner Channels: Differences and Similarities
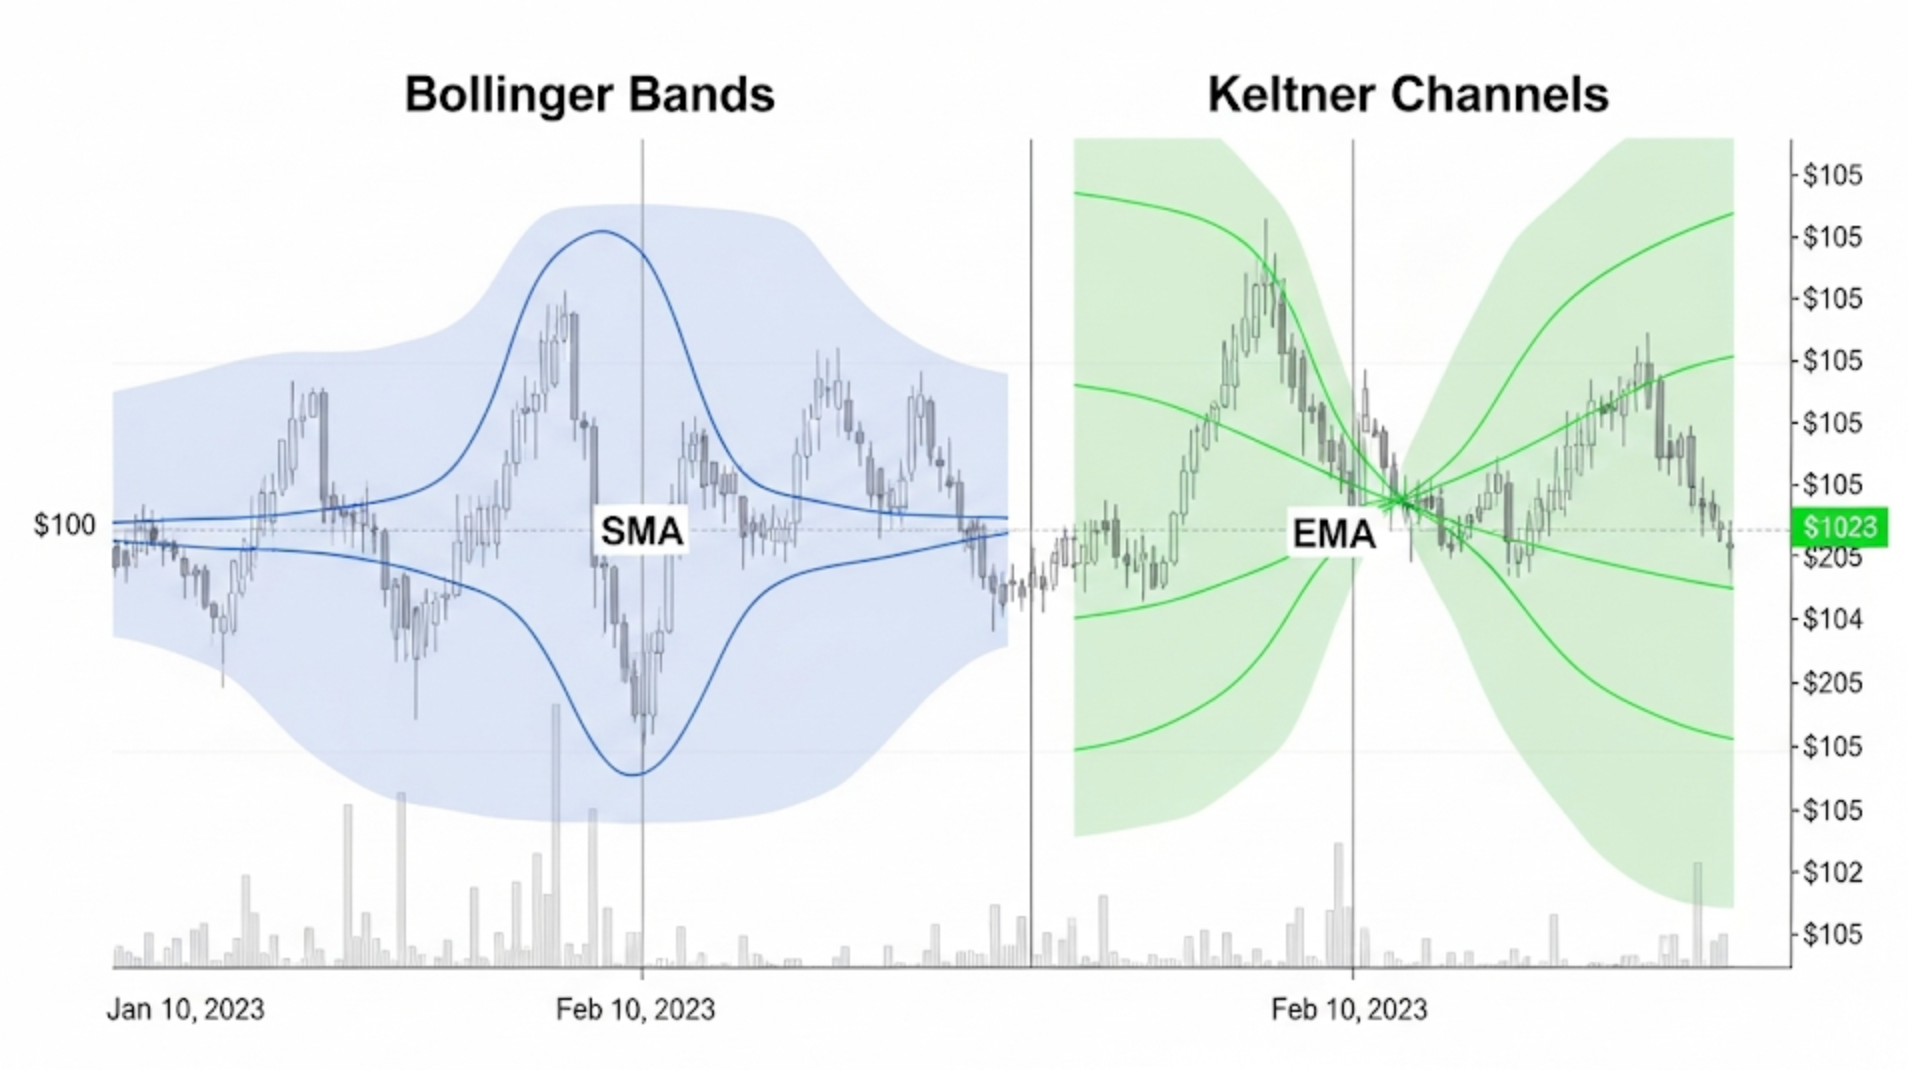
Another technical tool often compared with Bollinger Bands is the Keltner Channel (KC). Although these two indicators serve similar purposes, their calculation methods and signal behaviors differ:
- Bollinger Bands: Use a 20-day Simple Moving Average (SMA) as the middle line, and band width is based on standard deviation. Since standard deviation directly reflects price volatility, the bands tend to be more sensitive to price changes and can show sudden expansions.
- Keltner Channels: Use a 20-day Exponential Moving Average (EMA) as the middle line, and band width is determined by the Average True Range (ATR). ATR is another measure of volatility, and Keltner Channels typically have narrower bands compared to Bollinger Bands.
Example: Some traders believe Keltner Channels provide earlier overbought or oversold signals than Bollinger Bands. On the other hand, Bollinger Bands better represent market volatility and help anticipate explosive price moves.
Making More Informed Decisions with Bollinger Bands
Important considerations when using Bollinger Bands include:
- Combining with Other Indicators: Bollinger Bands alone may be insufficient for signal generation. Supporting them with RSI (Relative Strength Index), MACD (Moving Average Convergence Divergence), and others improves reliability.
- Price Breaking the Bands: Price moving outside the bands does not always indicate trend reversal; treating every band breakout as a signal carries risks.
- Adjusting for Market Conditions: Standard settings of 20 days and 2 standard deviations generally work well, but parameters may be modified for different assets or markets.
Conclusion: Understanding Market Volatility with Bollinger Bands
Bollinger Bands are a powerful tool to analyze market volatility, potential overbought-oversold zones, and support/resistance levels. They are especially useful for interpreting short to medium-term price movements. Expansion and contraction of the bands provide early insights into changes in market volatility.
However, it is best to evaluate Bollinger Bands alongside other technical analysis tools. Adjusting the indicator’s parameters according to market conditions can also increase success.
For investors, Bollinger Bands serve as a valuable guide in risk management and strategy building, helping take more informed and controlled steps in the markets when used correctly


Comments ()