What is the Adam Eve Formation?

In the world of cryptocurrency and stock markets, predicting price movements can be quite challenging. However, investors often rely on various chart patterns to help determine the potential direction of the market. One such pattern is the Adam Eve formation, which is a lesser-known but highly effective method for spotting trend reversals. In this post, we'll break down what the Adam Eve formation is and how it works.
What is the Adam Eve Formation?
The Adam Eve formation is considered an advanced version of a double bottom pattern. So, what does this pattern look like, and how does it behave?
The formation gets its name from a story. Adam represents the first dip, and Eve represents the second dip. The pattern occurs when the price drops sharply (Adam), followed by a rounder, more gradual dip (Eve). The key here is that you can clearly see two distinct lows in the chart, signaling a potential reversal of the trend.
Typically, the Adam Eve formation appears during a downtrend. The first dip is caused by panic selling, and the price falls sharply. After that, the price starts to consolidate and gradually moves higher, signaling a potential upward trend.

How Does the Adam Eve Formation Work?
The Adam Eve formation consists of two distinct dips. The first dip, Adam, is usually a sharp drop, while the second dip, Eve, is broader and rounder, signaling a recovery.
- Adam (First Dip): During the first dip, the price drops sharply due to panic selling or market correction. This is a brief, sudden decline.
- Eve (Second Dip): After the initial drop, the price gradually recovers, forming a more rounded second dip. This part signals that the market is stabilizing and potentially preparing for an upward movement.
- Price Surge: Between the two dips, the price difference should be at least 10%. Once this gap is exceeded, it could indicate a trend reversal and the beginning of an uptrend.
Example of the Adam Eve Formation
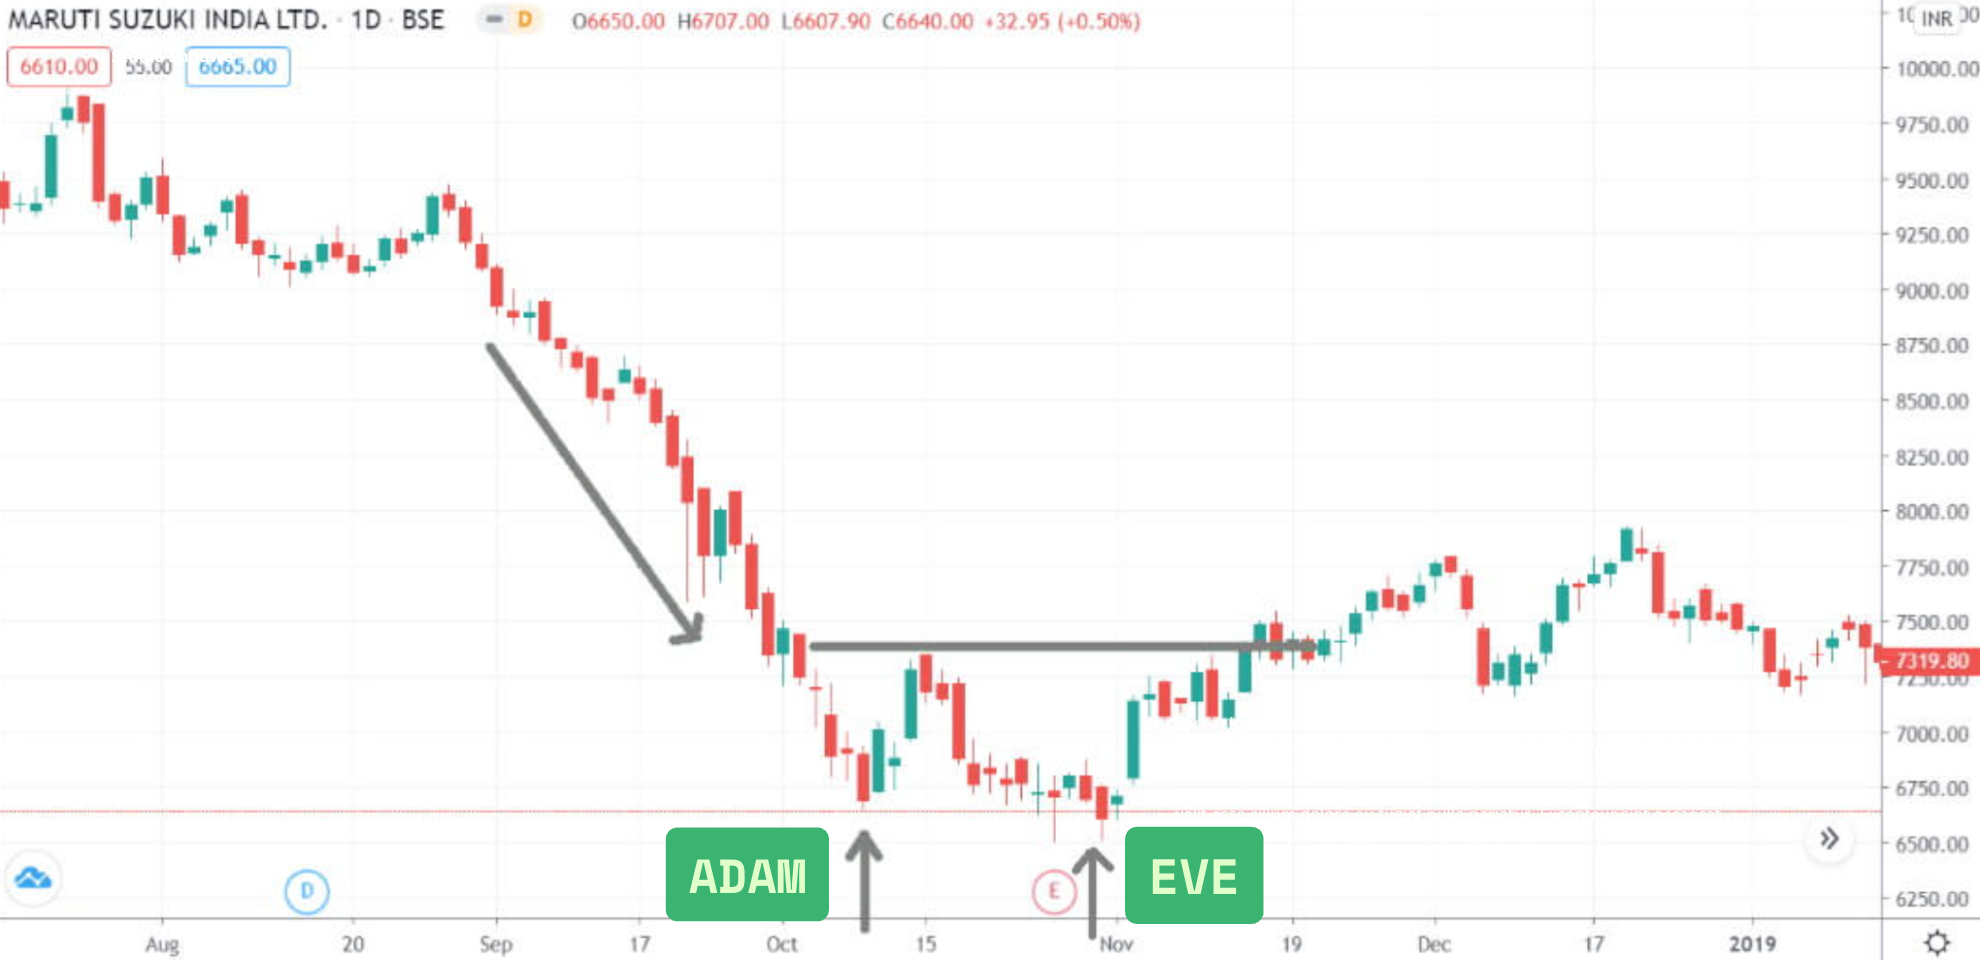
Let’s look at an example to better understand how the Adam Eve formation works. Take a look at the price chart of Maruti Suzuki in October 2018. The chart clearly shows the formation of the Adam Eve pattern.
- The first dip (Adam) occurred around 600 Rs.
- The second dip (Eve) was around 650 Rs.
- The price difference between the two dips was about 10%, signaling a potential upward movement.
After the formation completed, the price surged from 7300 Rs to 7900 Rs, demonstrating the pattern's reliability.
When is the Adam Eve Formation Reliable?
Several factors can enhance the reliability of the Adam Eve formation:
- Low Volume: If the formation occurs with decreasing volume, it indicates that the market is stabilizing, which makes the pattern more reliable. A volume decrease during the second dip signals a potential upcoming uptrend.
- Flat Base Before the Formation: If the market price has been moving horizontally (a flat base) before the formation, it increases the formation’s reliability. This flat period indicates that the market is in a consolidation phase and is ready to make a move.
- Time Interval: The time between the two dips is generally around 1 month. This gives enough time for the price to stabilize before the next move.
Conclusion
The Adam Eve formation is an essential tool for investors, as it provides insight into potential trend reversals. It indicates a shift from a downtrend to an uptrend, allowing investors to make better decisions. However, like any other technical analysis tool, the Adam Eve formation should be used as part of a broader strategy and combined with other analysis methods.
By recognizing this pattern early on, you can capitalize on potential bullish trends. But remember, it’s important to combine the Adam Eve formation with other signals to make more informed decisions


Comments ()