What is the Bullish Flag Pattern and How Does it Work?
In the world of cryptocurrency and stock trading, understanding chart patterns can provide traders with an edge in predicting future price movements. One of the most significant patterns in this regard is the Bullish Flag pattern. But what exactly is the Bullish Flag, how does it work, and how can traders use it to their advantage? In this blog post, we’ll break down the Bullish Flag pattern in a simple and clear way.
What is the Bullish Flag Pattern?
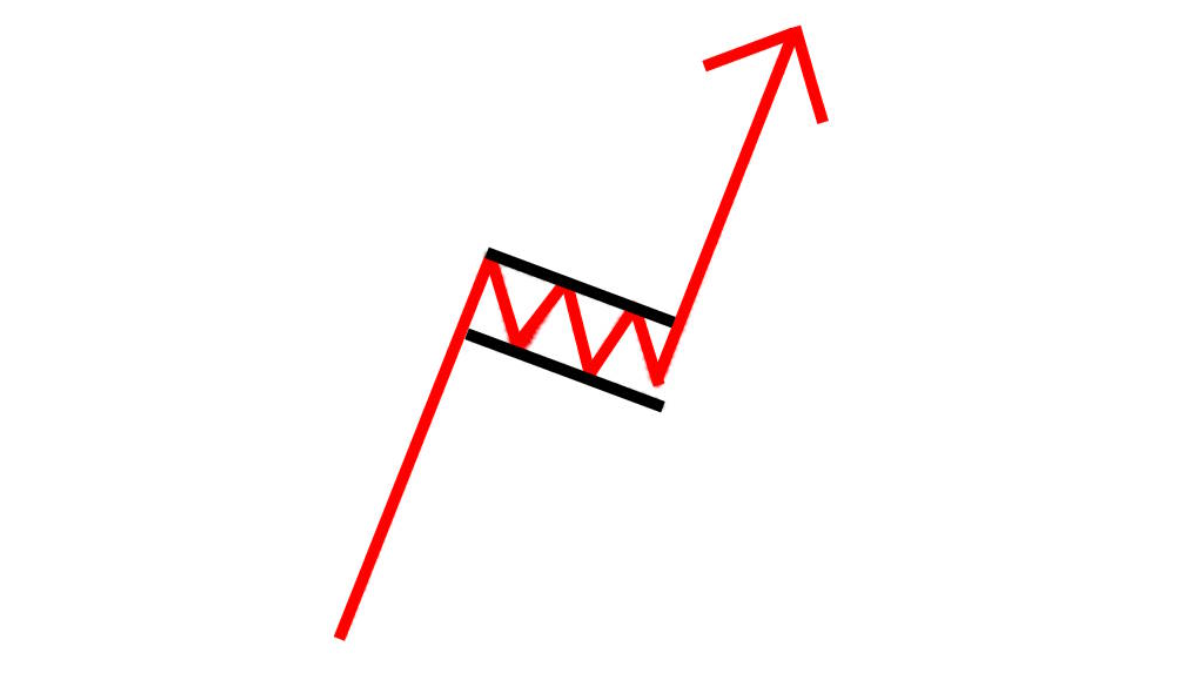
The Bullish Flag is a chart pattern that indicates a continuation of an upward trend after a brief consolidation period. It consists of two main components: the flagpole and the flag.
- Flagpole: This is the initial sharp rise in price, resembling a pole. It represents strong upward momentum in the market.
- Flag: After the flagpole, there is a consolidation period where the price moves sideways or slightly downward. This is the "flag" portion of the pattern.
The pattern is called a "Bullish Flag" because it looks like a flag on a pole. The flagpole represents the rapid upward price movement, and the flag portion reflects the consolidation phase. Typically, the flag will be sloping downward, but sometimes, it can also appear as a horizontal rectangular shape.
How Does the Bullish Flag Work?
The Bullish Flag pattern works as follows:
- Strong Upward Movement (Flagpole): Price rises sharply in a relatively short period, forming the flagpole. This indicates that buyers have control of the market, pushing the price higher.
- Consolidation Phase (Flag): After the initial price surge, the price enters a brief period of consolidation. During this phase, price movements tend to be more horizontal or slightly downward, and the trading volume decreases.
- Breakout: Once the consolidation phase is complete and the price breaks through the upper trendline of the flag, it signals a continuation of the upward trend. The price is expected to move higher, following the same direction as the initial flagpole.
The Bullish Flag pattern indicates that after a strong rally, the price is taking a short break before continuing its upward journey. When the breakout happens, the expectation is for a continuation of the previous bullish trend.
Why is the Bullish Flag a Reliable Pattern?
The Bullish Flag is considered one of the most reliable continuation patterns in technical analysis. Traders use it to identify opportunities where the price is likely to continue in the same direction after a brief consolidation. The reliability of the Bullish Flag depends on several factors:
- Tight Flag: The tighter the flag is (i.e., the narrower the consolidation range), the stronger the bullish signal is. A tight flag suggests that the buyers are still in control and that the price is more likely to break out upward.
- Volume: Volume plays an important role in confirming the pattern. During the flagpole formation, the volume typically increases, indicating strong buying interest. During the consolidation phase, the volume decreases, suggesting a temporary pause in the trend. A breakout with high volume confirms the continuation of the trend.

How Reliable is the Bullish Flag Pattern?
The Bullish Flag pattern is a highly reliable continuation signal in technical analysis. However, like all chart patterns, it is not foolproof. To maximize the chances of success, traders should pay attention to key elements such as volume, the tightness of the flag, and the overall market trend.
If all the elements align, the Bullish Flag is likely to lead to a continuation of the upward trend. However, traders should always use additional tools and indicators to confirm the breakout and manage risk accordingly.
What Happens After a Bullish Flag Breakout?
Once the price breaks above the flag and continues its upward movement, the price is expected to follow the same direction as the initial flagpole. The breakout usually leads to a sharp price increase, signaling that the bullish trend is still intact.
It is important to note that a Bullish Flag breakout is not a guarantee of success, but it significantly increases the probability of a continued upward trend. Traders who spot this pattern early can take advantage of the breakout by entering the market at the right time.
Summary
The Bullish Flag pattern is a chart formation that signals a continuation of an uptrend after a brief consolidation period. It consists of a strong price increase (flagpole) followed by a consolidation phase (flag). When the price breaks out of the flag, it often leads to a further upward movement, continuing the trend.
For traders, the Bullish Flag pattern can be a useful tool for identifying entry points during an ongoing uptrend. However, it is important to analyze volume and other indicators to ensure the breakout is valid and to minimize risk.
Frequently Asked Questions
- What does the Bullish Flag pattern look like? The Bullish Flag pattern shows a sharp rise (flagpole) followed by a period of consolidation (flag), usually in the form of a rectangular shape. Volume tends to increase during the flagpole and decrease during the flag.
- How reliable is the Bullish Flag pattern? The Bullish Flag is considered one of the most reliable continuation patterns in technical analysis. When the flag is tight and the breakout occurs with high volume, the pattern has a higher probability of success.
- What happens after a Bullish Flag breakout? After the breakout, the price is expected to continue rising, following the direction of the initial flagpole. This indicates that the bullish trend is likely to persist.
In conclusion, the Bullish Flag pattern is a powerful tool for traders looking to capitalize on a continuation of an uptrend. By understanding how the pattern forms and how to identify it, traders can increase their chances of making profitable trades. However, as with all patterns, it's important to confirm the breakout with other technical indicators and manage risk accordingly


Comments ()